Sunday, February 3, 2013

Pipeline free span mitigation


Nowadays, offshore pipelines have a significant role in development of oil and gas industry in different parts of the world. This crucial industry is laid on seabed by various methods either embedded in a trench (buried method) or laid on uneven seabed (unburied method). Construction of unburied pipeline is the most common method for its rapid and economic performance. In this method, however, the pipelines are subjected to various lengths of free spanning throughout the route during its life time, which may threaten the pipelines safety. Free spanning in offshore pipelines mainly occurs as a consequence of uneven seabed and local scouring due to flow turbulence and instability; hence, with no doubt, free spanning occurrences for unburied pipelines are completely inevitable.

Fredsoe and Sumer (1997) assessed the role of free spans in unburied offshore pipelines. They acknowledged the previous studies and mentioned that resonance is the main problem for offshore pipelines laid on the free spanning. Pipelines resonance happens when the external load frequency as a result of vortex shedding becomes equal to the pipe Natural Frequency. This phenomenon may burst the pipe coating and may lead to develop more fatigue on the pipelines. Different design guidelines, e.g. DNV (1998) and ABS (2001), have accepted a less stringent approach and recommend the free spanning to be reduced to the allowable length to avoid fatigue damage. These guidelines proposed a simple formulation to calculate the first Natural Frequency based on the pipelines specifications and seabed conditions; however, all of the guidelines encourages using modal analysis at the final phase of design.

Choi (2000) studied the effect of axial forces on free spanning of offshore pipelines. The results indicated that the axial force has a significant influence on the first Natural Frequency of the pipe. In this research, the different seabed condition has been broken down into three main types and the general beam equation for the boundary conditions was analytically solved. He also compared his result with Lloyd’s approximate formula, which estimates the first Natural Frequency of the beam considering axial load effect. Xu et al. (1999) applied the modal analysis to incorporate the real seabed condition to assess pipelines fatigue and Natural Frequency (NF). Later, Bai (2001) approved Xu et al. (1999) approach and emphasis on applying the modal analysis to determine the allowable length of free span for offshore pipelines.

In practice, a considerable amount of works have been applied to determine the allowable free span length, however, there is still lack of knowledge in assessing the role of all effective parameters in determination of allowable free span length. The objective of this paper is two folds: (i) to assess the role of main effective parameters on Natural Frequency; and (ii) to present a simple formula for allowable free span length with accounting for the seabed condition. To do so, first the approaches of DNV (1998) and ABS guidelines are discussed and then the modal analysis is outlined to have a useful tool to assess the role of all involved parameters. Finally, a case study on the Qeshem pipelines is performed to evaluate the free span allowable length.


Sumber :
84 International Journal of Civil Engineerng. Vol. 5, No. 1, March 2007
http://ijce.iust.ac.ir/browse.php?a_code=A-10-3-191&slc_lang=en&sid=1&sw=Offshore+pipelines

OFFSHORE PIPELINE INSTALLATION


Metode instalasi pipeline ada 3 macam yaitu S-Lay, J-Lay, dan Reel Lay
berikut adalah artikel terkait dengan sunber: http://www.rigzone.com/training/insight.asp?insight_id=311&c_id=19
Laying pipe on the seafloor can pose a number of challenges, especially if the water is deep. There are three main ways that subsea pipe is laid — S-lay, J-lay and tow-in — and the pipelay vessel is integral to the success of the installation.
Buoyancy affects the pipelay process, both in positive and negative ways. In the water, the pipe weighs less if it is filled with air, which puts less stress on the pipelay barge. But once in place on the sea bed, the pipe requires a downward force to remain in place. This can be provided by the weight of the oil passing through the pipeline, but gas does not weigh enough to keep the pipe from drifting across the seafloor. In shallow-water scenarios, concrete is poured over the pipe to keep it in place, while in deepwater situations, the amount of insulation and the thickness required to ward of hydrostatic pressure is usually enough to keep the line in place.
Tow-In Pipeline Installation
While jumpers are typically short enough to be installed in sections by ROVs, flowlines and pipelines are usually long enough to require a different type of installation, whether that is tow-in, S-lay or J-lay.
Tow-in installation is just what it sounds like; here, the pipe is suspended in the water via buoyancy modules, and one or two tug boats tow the pipe into place. Once on location, the buoyancy modules are removed or flooded with water, and the pipe floats to the seafloor.
Surface Tow Pipeline InstallationSurface Tow Pipeline InstallationSource: www.pipelife.no
S-Lay Pipeline Installation
S-Lay Pipeline InstallationSource: www.pbjv.com.my
Pipe being lowered into the water via a stinger for S-lay installation
Pipe being lowered into the water via a stinger for S-lay installationSource: www.nord-stream.com
J-Lay Pipeline Installation
J-Lay Pipeline InstallationSource: www.technip.com
J-Lay Pipelay Vessel S7000
J-Lay Pipelay Vessel S7000Source: www.hydro.com
Vertical Reel Barge
Vertical Reel BargeSource: www.jee.co.uk
There are four main forms of tow-in pipeline installation. The first, thesurface tow involves towing the pipeline on top of the water. In this method, a tug tows the pipe on top of the water, and buoyancy modules help to keep it on the water’s surface.
Using less buoyancy modules than the surface tow, the mid-depth tow uses the forward speed of the tug boat to keep the pipeline at a submerged level. Once the forward motion has stopped, the pipeline settles to the seafloor.
Off-bottom tow uses buoyancy modules and chains for added weight, working against each other to keep the pipe just above the sea bed. When on location, the buoyancy modules are removed, and the pipe settles to the seafloor.
Lastly, the bottom tow drags the pipe along the sea bed, using no buoyancy modules. Only performed in shallow-water installations, the sea floor must be soft and flat for this type of installation.
S-Lay Pipeline Installation
When performing S-lay pipeline installation, pipe is eased off the stern of the vessel as the boat moves forward. The pipe curves downward from the stern through the water until it reaches the “touchdown point,” or its final destination on the seafloor. As more pipe is welded in the line and eased off the boat, the pipe forms the shape of an “S” in the water.
Stingers, measuring up to 300 feet (91 meters) long, extend from the stern to support the pipe as it is moved into the water, as well as control the curvature of the installation. Some pipelay barges have adjustable stingers, which can be shortened or lengthened according to the water depth.
Proper tension is integral during the S-lay process, which is maintained via tensioning rollers and a controlled forward thrust, keeping the pipe from buckling. S-lay can be performed in waters up to 6,500 feet (1,981 meters) deep, and as many as 4 miles (6 kilometers) a day of pipe can be installed in this manner.
J-Lay Pipeline Installation
Overcoming some of the obstacles of S-lay installation, J-lay pipeline installation puts less stress on the pipeline by inserting the pipeline in an almost vertical position. Here, pipe is lifted via a tall tower on the boat, and inserted into the sea. Unlike the double curvature obtained in S-lay, the pipe only curves once in J-lay installation, taking on the shape of a “J” under the water.
The reduced stress on the pipe allows J-lay to work in deeper water depths. Additionally, the J-lay pipeline can withstand more motion and underwater currents than pipe being installed in the S-lay fashion.
Types Of Pipelay Vessels
There are three main types of pipelay vessels. There are J-lay and S-lay barges that include a welding station and lifting crane on board. The 40- or 80-foot (12- or 24-meter) pipe sections are welded away from wind and water, in an enclosed environment. On these types of vessels, the pipe is laid one section at a time, in an assembly-line method.
On the other hand, reel barges contain a vertical or horizontal reel that the pipe is wrapped around. Reel barges are able to install both smaller diameter pipe and flexible pipe. Horizontal reel barges perform S-lay installation, while vertical reel barges can perform both S-lay and J-lay pipeline installation.
When using reel barges, the welding together of pipe sections is done onshore, reducing installation costs. Reeled pipe is lifted from the dock to the vessel, and the pipe is simply rolled out as installation is performed. Once all of the pipe on the reel has been installed, the vessel either returns to shore for another, or some reel barges are outfitted with cranes that can lift a new reel from a transport vessel and return the spent reel, which saves time and money.

su


Pipeline on bottom stability


Pipeline on bottom stability is an interaction of pipe, water and soil. The important factor that taken into account is the water flow whereby determining the magnitude and time variation of hydrodynamic drag and lift forces.


The second factor is soil. There have 3 friction will happened which are static, sliding and cohesive friction. So, it’s very important to understand the soil condition at the pipeline route area so that accuracy of analysis achieved.
These are some input provided for on bottom stability analysis :

1. Pipeline Data
Outside diameter 
Wall thickness
Density of Pipe
Corrosion Coating Thickness
Corrosion Coating Density
Concrete Coating Thickness
Concrete Coating Density
Field Joint Material Density
Concrete Coating Cutback
Corrosion Coating Cutback
Pipe Joint Length


2. Wave and Current Data 
Significant Wave Height (Hs)
Spectral Peak Period (Tp)
Wave Angle
Wave Spectrum Type
Water Depth 
Current Velocity
Current References Height from Bottom
Peakedness Parameter


3. Physical Parameter
Density of Content
Density of Seawater
Marine Growth Thickness
Soil Type
Mean Grain Size – DNV RP E305
Roughness – DNV RP E305
Undrained Shear Strength (Su) – DNV RP E305
Lift Coefficient – –DNV RP E305
Drag Coefficient – DNV RP E305
Inertial Coefficient – DNV RP E305
Follow Part 9 for continuing of On Bottom Stability using AGA method

Sumber :

Intergrating seafloor study for pipeline routing


The principles of geometry state that "the shortest distance between two points is a straight line." Companies responsible for building pipelines on the continental slopes of our oceans only wish that this law could be applied. Rarely are operators provided the luxury of simply reviewing the sea-bottom from Point A to Point B and then installing a pipeline in a straight line.
The seafloor and near-seafloor geology are typically too complex or constraining to build such a steel lineament. It requires considerably more pre-planning when first deciding where to install a pipeline relative to Point A and Point B. When conducting a pipeline study there are generally four major steps that a design team should consider and implement:
  • Review existing regional and site specific data in the area
  • Plan a preliminary pipeline corridor
  • Conduct a detailed high-resolution geophysical/geotechnical study
  • Integrate the geophysics, geology, and geotechnical soils engineering results.
Integrating studies
Mariner Energy Company used a similar approach to the successful design of their Dulcimer Pipeline Project extending from Garden Banks Block 367 to Block 236. Geoscience Earth & Marine Services (GEMS) conducted the preliminary study for this and further completed the interpretations of the final geophysical data collected on the pipeline corridor survey. Intec Engineering was involved in the pipeline design and project management of this study; C&C Technologies conducted the field geophysical operations; Marsco conducted the geotechnical study.
The pipeline route is just west of Geyer Bank, a carbonate hard bank on the upper Louisiana continental slope. Rock outcrop, seafloor faults, expulsion mounds, and other seafloor features extend westward from the Bank. All of these geologic features caused deep concern in selecting a final and feasible route for pipeline deployment.
The direct route approach (Point A to Point B) would have been 64,484 ft in horizontal length. The actual survey showed that the pipeline must be routed around seafloor fault scarps, hard bottom conditions, and seep mounds which increased the horizontal pipeline length to 73,977 ft. The final pipeline corridor had to weave around several constraining geologic conditions The preliminary study greatly reduced the amount of time spent in the field to locate the appropriate route.
Water depths along the pipeline route range from 675 ft to 1,270 ft below sea level with variable gradient ranging from 1% to greater than 40%. Changes in elevation along the route only increased the pipe length by 0.02%, to a total length of 73,993 ft.

Review existing data
There generally is some information available on the regional morphology, seabed character, soils, and man-made infrastructure in an area where production and subsequent pipelines are planned. Too many times, however, this information is overlooked in pipeline route planning.
When pre-planning a pipeline corridor, the planners should consider what work has been previously done in the area, and how much, if any, of this data can be applied to the study. Public information, as well as proprietary data, is generally available in many areas of the world. In the Gulf of Mexico, for example, it is relatively easy to research and find which companies hold the rights on Federal OCS lease blocks, and what man-made infrastructure exists in the general vicinity of the planned pipeline route.
It is equally easy to determine if any high-resolution geophysical surveys have been completed over these lease holdings. Operators can be contacted to request use of such information in the planning of the route. The best interest of the operator may be achieved by working with the pipeline company to plan a feasible corridor for investigation of a route that will fit with the leaseholders plans for development (if any).
In many cases, the original or copied high resolution data is not always available from these surveys. However, the final geohazards reports are relatively easy to obtain either from the operator or from the public information files archived with the US Minerals Management Service (MMS), in the case of the US offshore. The information gleaned from these reports can be compiled into one complete sketch of the seafloor to define the bathymetric and geologic conditions across the corridor.
Other data
Regional data, such as swath bathymetry, and dense data sets such a 3D seismic, can be quite helpful when used properly. When these swaths of data have been collected in over lapping footprints, the resulting data file is a very dense sounding file of the seafloor topography.
Bathymetric maps and profiles can be generated to provide detail of subtle highs and lows along the seabed. The regional bathymetry and profile generation can assist the planners in eliminating terrain that does not look conducive to pipeline installation.
Depending on the density of data, an x,y,z-file of the seabed can then be rendered using one of many imaging software packages to produce a picture of the seafloor terrain. These renderings can provide a very detailed image of the topography, illustrating seafloor irregularities such as: fault scarps, slope instability failures (landslides), hard rock conditions, mounds, vents, chimneys, and other features that would cause concern to pipeline design.

3D seismic
Regional swath bathymetry is not always available over the area to be investigated. The operator may, however, have available 3D seismic data that can be used to pick the seafloor return and produce a similar bathymetry map and seafloor rendering.
Three-dimensional seismic data is generally of very high-quality, and dense coverage (bin-spacing generally 12.5 to 25 meters/bin), so that the seafloor is well represented. In addition, the amplitude of the seafloor can be sampled from these data and a rendering of high-amplitude seabed features can be illustrated.
These high-amplitude events generally show areas of hard bottom and/or areas of fluid venting at the seafloor. In the deep waters of the Gulf of Mexico, these vent and hard bottom areas can, be home to chemosynthetic communities.
Survey corridor
When the existing data is adequate, a map can be generated with all known water depth contours, geologic features, and man-made infrastructure. This map can then be used to select a preliminary pipeline corridor to avoid any potential obstructions. Multiple corridors may be selected depending on geologic and man-made obstructions, seafloor slope, pipe length, turns, crossing angle to other pipelines, and other features. Preliminary pipeline corridors may go through many iterations before settling on feasible routes to investigate.
Sometimes, the regional data is not sufficient to select a confident pipeline corridor. This can be especially true in remote areas of the world. One way to overcome this obstacle is to conduct your own area survey. The collection of swath bathymetric data can be done quickly over the area, and can be done with the same survey vessel contracted to perform the pipeline corridor.
Final contour maps, profiles, and renderings can be produced directly on the ship. Qualified geologists and pipeline engineers can select a feasible pipeline corridor directly on the vessel. The corridor can then be surveyed by the same vessel during the same field activity with the high-resolution geophysical suite of equipment.
Field survey
  • Geophysics: Once a survey corridor is planned from the review of existing data and/or from the acquisition of swath bathymetry, the next step is to complete the high-resolution geophysical survey. The number of survey lines and line spacing required for the survey depends on the type of lay-barge and/or method of pipe-laying operations. For instance, if a dynamically positioned lay barge is to be used, then an area of approximately 400 meters on a side from the proposed pipeline route is recommended. If an anchored lay-barge is utilized, the survey coverage should extend outward from the barge to the extent of anchorage. The data collected should consist of continuous echo-soundings, or better yet, full swath bathymetry, side-scan sonar imaging of the seafloor, subbottom profiling of the upper 50-100 ft of sediment, and magnetic detection. The benefits of the previous steps is to acquire only the amount of high-resolution geophysical data needed to define the final route.
  • Geotechnics: The onboard geologist should map the geologic features during the acquisition of the geophysical data. The geologist and geotechnical engineer should then communicate on the seismic variation in seafloor character to select locations for soil sampling. Piston drop cores and in situ tests collected along the route assist to "ground truth" the geologic interpretations. The collected samples can then be returned to the soils laboratory for further testing.
Traditionally, shallow drop-core samples are taken at intervals along the pipeline route to define the soil properties. Since the pipeline support is essentially influenced by the upper two meters of sediments, it is important that good soil data be acquired throughout this zone.
Pipeline trenching and burial for thermal insulation is another consideration that may need to be studied. Special in-situ tests should also be conducted during the field program in order to provide geotechnical parameters for subsequent design of equipment if trenching and burial is a consideration.
Integrated results
The final step in a pipeline study is to integrate all phases of work into a single, concise geologic model that defines the seafloor and subsurface conditions, and describes that model in a report that is understandable by all members of the pipeline team responsible for the safe installation and use of the pipeline.
The interpreted geophysical/geotechnical data defines an integrated geologic/soil model in three dimensions along the entire pipeline route. Basic interpretative maps can include:
  • Bathymetry and seafloor gradient
  • Seafloor topography, such as seafloor mounds or fault scarps
  • Basic geologic features such as faults, shallow gas, and hydrates
  • Soil provinces including variations in geotechnical properties
  • Manmade features or debris
  • Areas occupied by chemosynthetic communities
  • Areas of seafloor instability.
Thus, the final route can be selected with a complete understanding of seafloor conditions (topography, geology, and soils) to avoid regions of irregular seafloor or difficult geologic conditions such as rock outcrops, fault scarps, and other features. Pipeline designers will use the seafloor topography and soil properties along the route to address such design considerations as spanning, settlement, and stability (sliding or erosion of the soils providing the foundation support).
In addition, the topographic data and three-dimensional soil model may be used by the geotechnical engineer to quantitatively assess the slope stability in areas with the steep seafloor gradients. The integrated data will also help select the most favorable site for subsea installations and anchors for a floating production system.
Conclusions
The phased approach to deepwater routing studies provides many technical and financial benefits if performed in a systematic and logical order. The Dulcimer Project illustrates the benefits derived from this approach:
  • Existing data is used to the maximum extent to define the complexity of the geologic setting
  • Multiple routes can be selected and studied before settling on the more feasible route to be surveyed
  • Provides preliminary information to pipeline designers before any survey data has been collected
  • Limits the amount of additional geophysical and geotechnical data required
  • Decreases geophysical and geotechnical field time, thereby reducing field costs
  • Provides a concise geologic/soil model that defines seafloor and subsurface conditions for all pipeline design team members.
The phased approach allows pre-planning with existing data and avoids unnecessary field work, which ultimately saves time and money on deepwater pipeline route surveys.
Acknowledgement
The authors would like to express thanks to Dave Huber with Mariner Energy (Houston), Spinnacker Exploration Company, Pogo Producing Company, Intec Engineering (Houston), C&C Technologies (Lafayette, Louisiana), Marsco (Houston) and Geoscience Earth & Marine Services (Houston).

sumber: http://www.offshore-mag.com/articles/print/volume-59/issue-6/departments/technology-focus/integrating-seafloor-studies-for-pipeline-routing.html

Fatigue Free span


Fatigue and its relationship to roster cycle length 
Helen Wood, Managing Director TMS Consulting

Abstract
Roster design and work schedules, if poorly designed or managed ineffectively, are associated with a variety of psychosocial and physiological problems that can affect the health and well-being of workers. As recognised by the Australian Pipeline Industry Association, the impact of fatigue in the Pipeline industry is gaining increasing prominence in terms of its effects and management strategies. This paper focuses on a review of the research literature pertaining to fatigue and the impact of sleep on fatigue, and the relationship with roster cycle length. Recommendations are provided for fatigue and sleep management strategies.  
Based on the research reviewed, there is limited evidence to suggest that a longer cycle is less safe or results in higher levels of fatigue, rather pre-existing fatigue and adequate sleep must be managed effectively. These results provide support for active fatigue management to have the ability to reduce the risk of accidents and incidents that are assumed with longer roster cycles. Further, it is recognised that there is very limited research available focused specifically on the impact of roster cycle length on worker fatigue in the Pipeline industry.
TMS Consulting has been engaged by APIA to conduct a Fatigue Management Study (FMS) to identify the impact of fatigue in the Pipeline industry, in particular its relationship to roster cycle length, and to test strategies around managing fatigue. Results from this study will provide valuable intelligence for the Pipeline industry, and inform improvements in fatigue management.
Introduction
Roster design and work schedules, if poorly designed or managed ineffectively, are associated with a variety of psychosocial and physiological problems that can affect the health and well-being of workers. In the Pipeline industry, fatigue is one variable which is becoming increasingly prominent in terms of management strategies and its relationship to roster cycle length.  
This paper will focus on a review of the research literature pertaining to fatigue, including typical signs and symptoms of fatigue, causes and consequences of fatigue, the impact of sleep on fatigue, and best practice methods of measuring fatigue. Research relating to workplace fatigue and sleep will be explored, in addition to recommendations for fatigue and sleep management strategies.
Roster Cycle Length
Organisations within the Pipeline and comparable industries have demonstrated a level of disparity in the design of roster schedules with no evidence of universal agreement regarding „best practice‟ for roster design.  
A variety of roster schedules are used both nationally and internationally in the Pipeline and comparable industries. A recent Work Cycle Study conducted by TMS Consulting (2010) involved interviews with a number of Pipeline industry representatives and, in addition to a review of the literature, found evidence of a broad range of roster cycle lengths worked in both the Pipeline and comparable industries (i.e. mining and petroleum).


The Australian Pipeline Industry Association (APIA), in conjunction with the Minerals Industry Safety and Health Centre (MISHC), conducted a survey in 2006 which looked at different roster arrangements used within the Pipeline industry.9 The survey was completed by members of APIA and then discussed at a Fatigue Management workshop in Brisbane in April 2006. Findings from the survey and workshop included:  
 Work in the Australian Pipeline industry may involve working in remote areas in difficult climates for shifts up to 12 hours over an extended roster pattern.7  The number of reported consecutive shifts worked by the labour workforce varied from three to 28 and up to 35 for some contractors. 9  The shift length varied from eight to 12 hours with the number of breaks within shifts ranging from one to four and of 20 minutes to one hour duration. 9  Travel times varied from five minutes to two hours. 9  Outcomes from the workshop discussion indicated that hours of work and roster patterns were not identified as the most significant issues contributing to fatigue. This may be due to the fact that most Pipeline operations work daylight hours and so avoid some of the major fatigue issues associated with night shift.6
Fatigue
The term „fatigue‟ is a general term used to describe the feeling of being tired, drained or exhausted.10 Fatigue is a physical condition that can result from physical exertion, mental exertion, or inadequate or disturbed sleep.1, 30 A certain level of fatigue is a natural response to the mental and physical effort of everything we do, and adequate sleep is essential for restoring the balance and promoting recovery.14  
Signs and symptoms of fatigue can typically be grouped into three categories: physical, mental and emotional. These include: 7, 17, 18, 21, 30,  Physical: Yawning, heavy eyelids, eye-rubbing, sore and/or bloodshot eyes, sluggish appearance, blurred vision, head dropping, micro sleeps, not feeling refreshed after sleep, reduced performance, slower reaction time, impaired hand-eye coordination, and headaches.  Mental: Difficulty concentrating on a task, lapses in attention, difficulty remembering what you are doing, failure to communicate important information, failure to anticipate events or actions, risk taking behaviour, disorganisation, lack of situational awareness, accidentally doing the wrong thing (error), and accidentally not doing the planned thing (omission).  Emotional: More quiet than usual, withdrawn, increased stress levels, reduced motivation, lacking energy, anxiety, irritability, decreased tolerance, depression, mood disturbances, emotional outburst, aggression, and rage.
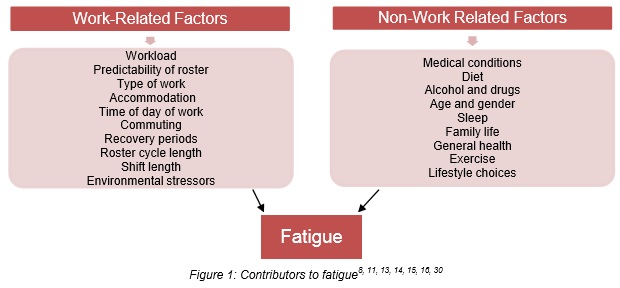
The literature has identified many factors that have the potential to increase the risk of fatigue. These factors are categorised as Work-Related or Non-Work Related and include, but are not limited to those outline in Figure 1.
As can be seen in Figure 1, roster cycle length is one of many factors which has the potential to increase the risk of fatigue, however, all need to be taken into consideration when conducting a risk assessment and developing a fatigue management plan.  

In terms of determining fatigue levels, it is not possible to directly measure fatigue, however three methods have generally been used when carrying out fatigue research:11, 30, 36  Devices capable of detecting performance impairment prior to or during a work shift, or monitoring real-time performance in the workplace. For example: o Psychomotor Vigilance Task (PVT) o Reaction Time/Macworth Clock testing device o The Occupational Safety Performance Assessment Test (OSPAT) o The FIT2000 system o The PERCLOS system o Stimulus-response tasks o Head nodding  Predictive models that calculate the amount of sleep opportunity and extrapolate from that the likelihood of fatigue and recovery. For example: o Fatigue Audit InterDyne (FAID) o Fatigue Avoidance Scheduling Tool (FAST)  Self-report measures of fatigue

Vortex Induced Vibration


In fluid dynamics, vortex-induced vibrations (VIV) are motions induced on bodies interacting with an external fluid flow, produced by – or the motion producing – periodical irregularities on this flow.
A classical example is the VIV of an underwater cylinder. You can see how this happens by putting a cylinder into the water (a swimming-pool or even a bucket) and moving it through the water in the direction perpendicular to its axis. Since real fluids always present some viscosity, the flow around the cylinder will be slowed down while in contact with its surface, forming the so called boundary layer. At some point, however, this boundary layer can separate from the body because of its excessive curvature. Vortices are then formed changing the pressure distribution along the surface. When the vortices are not formed symmetrically around the body (with respect to its midplane), different lift forces develop on each side of the body, thus leading to motion transverse to the flow. This motion changes the nature of the vortex formation in such a way as to lead to a limited motion amplitude (differently, then, from what would be expected in a typical case of resonance).
VIV manifests itself on many different branches of engineering, from cables to heat exchanger tube arrays. It is also a major consideration in the design of ocean structures. Thus study of VIV is a part of a number of disciplines, incorporating fluid mechanics, structural mechanics, vibrations, computational fluid dynamics (CFD), acoustics, statistics, and smart materials.

They occur in many engineering situations, such as bridges, stacks, transmission lines, aircraft control surfaces, offshore structures, thermowells, engines, heat exchangers, marine cables, towed cables, drilling and production risers in petroleum production, mooring cables, moored structures, tethered structures, buoyancy and spar hulls, pipelines, cable-laying, members of jacketed structures, and other hydrodynamic and hydroacoustic applications. The most recent interest in long cylindrical members in water ensues from the development of hydrocarbon resources in depths of 1000 m or more.
Vortex-induced vibration (VIV) is an important source of fatigue damage of offshore oil exploration and production risers. These slender structures experience both current flow and top-end vessel motions, which give rise to the flow-structure relative motion and cause VIV. The top-end vessel motion causes the riser to oscillate and the corresponding flow profile appears unsteady.
One of the classical open-flow problems in fluid mechanics concerns the flow around a circular cylinder, or more generally, a bluff body. At very low Reynolds numbers (based on the diameter of the circular member) the streamlines of the resulting flow is perfectly symmetric as expected from potential theory. However as the Reynolds number is increased the flow becomes asymmetric and the so called Kármán vortex street occurs.
The Strouhal number relates the frequency of shedding to the velocity of the flow and a characteristic dimension of the body (diameter in the case of a cylinder). It is defined as St=f_{st}D/U and is named after Čeněk (Vincent) Strouhal (a Czech scientist). In the equation fst is the vortex shedding frequency (or the Strouhal frequency) of a body at rest, D is the diameter of the circular cylinder, and U is the velocity of the ambient flow. The Strouhal number for a cylinder is 0.2 over a wide range of flow velocities. The phenomenon of lock-in happens when the vortex shedding frequency becomes close to a natural frequency of vibration of the structure. When this happens large and damaging vibrations can result.

Much progress has been made during the past decade, both numerically and experimentally, toward the understanding of the kinematics (vice dynamics) of VIV, albeit in the low-Reynolds number regime. The fundamental reason for this is that VIV is not a small perturbation superimposed on a mean steady motion. It is an inherently nonlinear, self-governed or self-regulated, multi-degree-of-freedom phenomenon. It presents unsteady flow characteristics manifested by the existence of two unsteady shear layers and large-scale structures.
There is much that is known and understood and much that remains in the empirical/descriptive realm of knowledge: what is the dominant response frequency, the range of normalized velocity, the variation of the phase angle (by which the force leads the displacement), and the response amplitude in the synchronization range as a function of the controlling and influencing parameters? Industrial applications highlight our inability to predict the dynamic response of fluid–structure interactions. They continue to require the input of the in-phase and out-of-phase components of the lift coefficients (or the transverse force), in-line drag coefficients, correlation lengths, damping coefficients, relative roughness, shear, waves, and currents, among other governing and influencing parameters, and thus also require the input of relatively large safety factors. Fundamental studies as well as large-scale experiments (when these results are disseminated in the open literature) will provide the necessary understanding for the quantification of the relationships between the response of a structure and the governing and influencing parameters.
It cannot be emphasized strongly enough that the current state of the laboratory art concerns the interaction of a rigid body (mostly and most importantly for a circular cylinder) whose degrees of freedom have been reduced from six to often one (i.e., transverse motion) with a three-dimensional separated flow, dominated by large-scale vortical structures.

sumber: wikipedia, http://www3.imperial.ac.uk/pls/portallive/docs/1/34707696.JPG


Pipeline Risk Assessment


berikut ini merupakan postingan artikel yang dikutip dari: digilib ITS dengan judul Risk Assessment Pipa Gas Lapindo Brantas, Inc. Terkait Rencana Peningkatan Tekanan Kerja Dengan Metode Kuantitative oleh Rosyida Harisa, Puri Dwi Priyanta, dan Trika Pitan

Perkembangan penggunaan gas alam selalu mengalami peningkatan dari tahun ke tahun. Salah satu keuntungan dari penggunaan gas alam dibanding dengan sumber energi lain adalah energi yang dihasilkan gas alam lebih efisien, jauh lebih bersih dan sangat ramah lingkungan sehingga tidak menimbulkan polusi terhadap lingkungan. Di samping itu, gas alam juga mempunyai beberapa keunggulan lain, seperti tidak berwarna, tidak berbau, tidak beracun dan tidak korosif. Di Energy Information Administration (USA) dalam International Energy dibandingkan sumber energi lain akan naik menjadi 28%, dari 23% pada tahun 1999. Berdasarkan data dari sumber yang sama pula disebutkan bahwa jumlah cadangan gas alam jika dengan tingkat konsumsi sekarang ini, akan dapat bertahan sampai lebih dari 60 tahun. Sementara itu cadangan minyak dunia dengan tingkat pemakaian yang sama seperti saat ini, diperkirakan hanya akan bisa bertahan sampai 40 tahun ke depan saja.

Di Indonesia, tahun 2003 yang lalu Pemerintah Indonesia mengeluarkan Kebijakan Energi Nasional (KEN), yang isinya menghapus ketergantungan konsumsi energi bangsa kita dari minyak bumi ke energi alternatif. Minyak bumi diusahakan akan digantikan secara perlahan hingga tahun 2025. Konsumsi minyak bumi diupayakan pada tahun itu hanya cukup berperan sebesar 20 persen saja dimana sekarang minyak bumi sangat dominan. Hal inilah yang melatarbelakangi Lapindo Brantas, Inc. sebagai salah satu produsen gas alam di Jawa Timur untuk terus meningkatkan hasil produksi baik secara kualitas maupun kuantitasnya.
Lapindo Brantas, Inc adalah perusahaan yang yang bekerja sama dengan BPMIGAS bergerak dalam bidang migas dan memiliki beberapa asset pipeline. Beberapa asset yang dimiliki diantaranya adalah bentangan pipa yang berada di desa Wunut, Kec. Tanggulangin, Kab. Sidoarjo. Namun, semenjak terjadinya bencana alam lumpur di Porong, Sidoarjo, mayoritas sumber daya manusia serta sumber dana yang dimiliki oleh Lapindo Brantas, Inc. banyak terkuras untuk penanggulangannya baik masalah sosial maupun teknis. Oleh karena itu, penaikkan tekanan gas dari 100psi menjadi 300psi diharapkan dapat menambah produksi gas Lapindo Brantas, Inc.

Di sisi lain, untuk menjaga keandalan dari suatu pipeline Kementrian Pertambangan dan Energi Republik Indonesia mengeluarkan keputusan yang tertera pada Kepmen No. 300K/38/M.PE/1997 tentang keselamatan kerja pipa penyalur minyak dan gas bumi. Dalam keputusannya, apabila terjadi perubahan kondisi lingkungan pada jalur pipa, pengusaha wajib melakukan analisa risiko untuk menetapkan langkah pengaman tambahan. Oleh karena itu, diadakan studi analisa risiko dengan penilaian risiko (risk assessment) pada jaringan pipa dengan menggunakan metode Societal Risk Assessment yang mengacu pada standar API 581.

Societal risk assessment merupakan salah satu metode untuk menilai risiko yang berpedoman pada pendapat masyarakat social suatu negara untuk menentukan tingkat risiko suatu sistem suatu atau asset atau biasa dikenal societal acceptable. Societal risk assessment mendeskripsikan tingkat risiko atau risk profile dengan menggunakan kurva FN. Kurva FN menggambarkan pertemuan antara kemungkinan terjadinya fatalities dengan jumlah kematian yang mungkin terjadi bila suatu scenario kegagalan terjadi. Semakin padat suatu Negara atau daerah di sekitar risk source, maka semakin besar pula tingkat risiko sosialnya. Metode ini biasa digunakan pada asset yang terletak di pemukiman padat.